How to Identify Stage 1 Stocks Before a Breakout
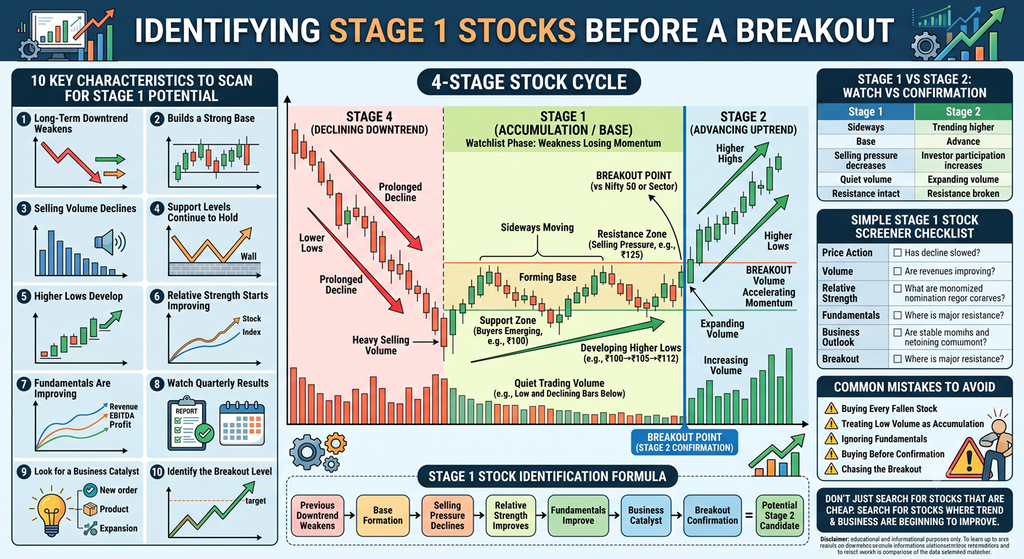
How to identify Stage 1 stocks is an important skill for investors looking for companies that may be transitioning from a long period of weakness into a potential new uptrend.
A Stage 1 stock is typically in a basing or accumulation phase. The previous downtrend has started losing momentum, selling pressure may be declining, and the share price begins moving sideways.
However, Stage 1 does not mean the stock has already entered an uptrend. It is better viewed as an early watchlist phase that requires confirmation.
The objective is to identify stocks where the price structure, volume, relative strength, and business fundamentals are gradually improving.
What Is Stage 1 in the Stock Market?
Stage 1 is the phase in a stock’s price cycle when a previous downtrend begins to lose strength, and the stock starts building a base.
A simplified four-stage stock cycle is:
Stage 1 → Accumulation / Base
Stage 2 → Advancing Uptrend
Stage 3 → Distribution
Stage 4 → Declining Downtrend
For investors, Stage 1 can be particularly interesting because it occurs before the stock enters a clearly established Stage 2 uptrend.
The challenge is that a Stage 1 base can also fail.
Therefore, investors should focus on identifying evidence of improving conditions, rather than assuming that every sideways stock will eventually break out.
How to Identify Stage 1 Stocks
There are several characteristics investors can examine when searching for potential Stage 1 stocks.
1. The Long-Term Downtrend Starts Losing Momentum
Start with the bigger picture.
Look at the weekly or monthly chart and determine whether the stock has experienced a prolonged decline.
A potential Stage 1 setup may develop when:
- The stock stops making continuous lower lows
- Selling becomes less aggressive
- Large downward moves become less frequent
- The price begins consolidating
- Important support levels start holding
A stock that continues making fresh lows without establishing a base should generally not be considered a strong Stage 1 candidate.
2. The Stock Builds a Base
The formation of a trading range is one of the most important characteristics of Stage 1.
Instead of moving continuously lower, the stock starts oscillating between support and resistance.
For example:
Support → ₹100
Resistance → ₹125
The stock may repeatedly move between these levels while investors wait for a new catalyst.
The duration of the base can vary significantly. Some stocks consolidate for several months, while others can remain in a range for considerably longer.
The important factor is the change in trend behaviour, not a fixed number of days.
3. Selling Volume Starts Declining
Volume can provide another useful clue.
During a major decline, heavy selling can push the stock lower. As the decline matures, trading volume may gradually decrease.
A potential pattern can look like:
Heavy selling → declining volume → quiet consolidation → increasing volume on advances
The low-volume period does not itself confirm accumulation.
The more meaningful signal can come later when volume expands as the stock approaches or breaks through resistance.
4. Support Levels Continue to Hold
A Stage 1 stock often develops an identifiable support area.
If the stock repeatedly falls toward a particular zone but buyers emerge and prevent a sustained breakdown, that area becomes important.
For example:
₹105 → ₹125 → ₹108 → ₹123 → ₹110 → ₹127
The repeated recovery from approximately the same zone suggests that buyers are becoming active around that area.
However, investors should remember that support is not guaranteed to hold.
A decisive breakdown can invalidate the Stage 1 setup.
5. Look for Higher Lows
Another useful sign is the development of higher lows.
Consider this sequence:
₹100 → ₹120 → ₹105 → ₹125 → ₹112 → ₹130
The lows are gradually moving higher.
This can indicate that demand is improving.
A higher-low structure combined with improving relative strength and fundamentals can make a stock more interesting to monitor.
6. Relative Strength Starts Improving
Price alone does not tell the entire story.
Investors can compare the stock’s performance with:
- Nifty 50
- Relevant sector index
- Industry peers
- Midcap or smallcap benchmark
Suppose the broader market falls significantly while a particular stock remains relatively stable.
That stock may be demonstrating relative strength.
An even stronger signal can occur when the market begins recovering, and the stock starts outperforming its benchmark.
Improving relative strength during a base can therefore be an important factor when building a Stage 1 watchlist.
7. Check Whether the Company’s Fundamentals Are Improving
Technical analysis identifies the price structure, but fundamentals help explain why the company might eventually attract investors.
When screening Stage 1 stocks, examine:
- Revenue growth
- EBITDA margins
- Profit growth
- Earnings per share
- Operating cash flow
- Debt levels
- Return on equity
- Return on capital employed
- Order book
- Capacity expansion
- Industry demand
The ideal setup is not simply a stock that has fallen substantially.
A more interesting situation may be:
Stock price weak or sideways + business fundamentals improving
This combination deserves further investigation.
8. Watch Quarterly Results
Quarterly results can help investors determine whether a company’s business is turning around.
For example:
Revenue: Declining → Stable → Growing
Margins: Weak → Stable → Improving
Profit: Falling → Stabilising → Accelerating
If the financial performance begins improving while the stock is still consolidating, the company may become an interesting Stage 1 watchlist candidate.
However, one strong quarter should not automatically be treated as a confirmed turnaround.
Investors should examine the trend across multiple quarters.
9. Look for a Business Catalyst
A stock can remain in a Stage 1 base for a long time if there is no catalyst.
Potential catalysts include:
- New orders
- Capacity expansion
- New product launches
- Industry recovery
- Debt reduction
- Improving margins
- Regulatory changes
- Government policy support
- Acquisitions
- New geographical markets
- Stronger management guidance
The catalyst should ideally have a measurable impact on the company’s future earnings or business outlook.
10. Identify the Breakout Level
Every Stage 1 setup should have a clearly defined resistance zone.
Suppose a stock has repeatedly failed near ₹150.
That level becomes an important resistance area.
The transition could look like:
Stage 1: ₹110–₹150 consolidation
↓
Resistance: ₹150
↓
Breakout: Above ₹150
↓
Stage 2: Higher highs and higher lows
The breakout is important because it provides evidence that demand has finally overcome the supply available near resistance.
What Confirms a Stage 1 Stock Has Entered Stage 2?
A stock does not become a confirmed Stage 2 uptrend merely because it rises for one or two sessions.
Investors should look for confirmation such as:
- Breakout above major resistance
- Higher highs
- Higher lows
- Increasing volume
- Improving relative strength
- Sustained price above the breakout area
- Continued fundamental improvement
A failed breakout, particularly one accompanied by heavy selling, should be treated cautiously.
Stage 1 vs Stage 2
Understanding the difference is critical.
Stage 1
- Long-term decline has weakened
- Price moves sideways
- Base develops
- Selling pressure decreases
- Volume may become quieter
- Fundamentals may begin improving
- Resistance remains intact
Stage 2
- Resistance is broken
- Price begins trending higher
- Higher highs and higher lows develop
- Volume may increase
- Relative strength improves
- Investor participation increases
Therefore:
Stage 1 = Watch
Stage 2 = Confirmation
This distinction can help investors avoid buying simply because a stock appears cheap after a major fall.
A Simple Stage 1 Stock Screener
Investors can create a basic checklist for identifying potential Stage 1 stocks.
Price Action
- Has the stock fallen significantly from its previous high?
- Has the decline slowed?
- Is the stock moving sideways?
- Is a recognizable base forming?
- Are higher lows developing?
Volume
- Has heavy selling volume declined?
- Is volume increasing on positive price movements?
- Does the potential breakout have strong volume?
Relative Strength
- Is the stock outperforming its sector?
- Is it outperforming the broader market?
- Is relative strength improving?
Fundamentals
- Are revenues improving?
- Are profits improving?
- Are margins recovering?
- Is debt manageable?
- Is cash flow improving?
Business Outlook
- Is the industry improving?
- Is there a new growth opportunity?
- Is the company expanding capacity?
- Is the order book increasing?
- Is management guidance improving?
Breakout
- What is the major resistance?
- Has the stock broken above it?
- Is the breakout supported by volume?
- Has the breakout sustained?
A Simple Example
Consider a hypothetical stock that falls from ₹250 to ₹100.
Instead of continuing lower, it begins trading between ₹100 and ₹135 for several months.
During this period:
- Selling volume decreases
- Support near ₹100 holds
- Quarterly earnings begin improving
- Debt starts declining
- Relative strength improves
- The stock begins making higher lows
The ₹135 level becomes important resistance.
If the stock later moves above ₹135 with strong participation and sustains the breakout, it could indicate a transition from Stage 1 to Stage 2.
The important point is that the investor did not need to predict that ₹100 was the exact bottom.
The focus was on identifying the behaviour change.
Common Mistakes When Searching for Stage 1 Stocks
Mistake 1: Buying Every Stock That Has Fallen
A stock can fall 70% and continue falling.
A large decline does not automatically indicate accumulation.
Mistake 2: Treating Low Volume as Accumulation
Low volume can simply mean that investors have lost interest.
Volume should be evaluated together with price action.
Mistake 3: Ignoring Fundamentals
A technically attractive chart can still belong to a business with deteriorating earnings, excessive debt, or weak cash flow.
Mistake 4: Buying Before Confirmation
Stage 1 is an early setup, not a guaranteed signal.
Some bases break down rather than break out.
Mistake 5: Chasing the Breakout
Even after a breakout, investors should assess whether the move is genuine and sustainable rather than buying solely because the stock suddenly rises.
Stage 1 Stock Identification Formula
A simple framework for research can be:
Previous Downtrend Weakens
Base Formation
Selling Pressure Declines
Relative Strength Improves
Fundamentals Improve
Business Catalyst
Breakout Confirmation
=
Potential Stage 2 Candidate
This is not a guaranteed formula for identifying winning stocks. It is a framework for narrowing down stocks that deserve deeper research.
Why Stage 1 Stocks Can Be Difficult to Find
Stage 1 is usually the least exciting phase of the stock cycle.
There may be:
- Little media attention
- Limited investor enthusiasm
- Sideways price movement
- Low trading activity
- Uncertainty about the company’s future
Once a stock enters Stage 2 and begins rising strongly, it often attracts significantly more attention.
This is why investors who want to identify opportunities early need patience and a systematic screening process.
Final Takeaway
Identifying Stage 1 stocks is ultimately about recognizing a transition.
You are not simply looking for stocks that have fallen sharply.
You are looking for stocks where:
the downtrend is weakening, a base is forming, selling pressure is declining, relative strength is improving, and the underlying business is showing signs of recovery.
The eventual breakout above resistance provides stronger evidence that the stock may be entering Stage 2.
For investors, the key principle is:
Don’t search only for stocks that are cheap. Search for stocks where the trend and the business are beginning to improve.
Stage 1 can put a stock on the radar. Stage 2 provides confirmation. Combining technical structure with fundamental research can help investors build a more disciplined stock-selection process.
Important Disclaimer
This article is for educational and informational purposes only and does not constitute investment advice, financial advice, or a recommendation to buy, sell, or hold any stock or security. The Stage 1 stock-identification methods discussed are general analytical concepts and do not guarantee future price performance or investment returns. Investors should conduct their own research, evaluate their risk tolerance, and consult a qualified financial advisor before making investment decisions. FutureSense does not accept responsibility for any losses arising from investment decisions based on the information presented in this article.